Monitoring LLM
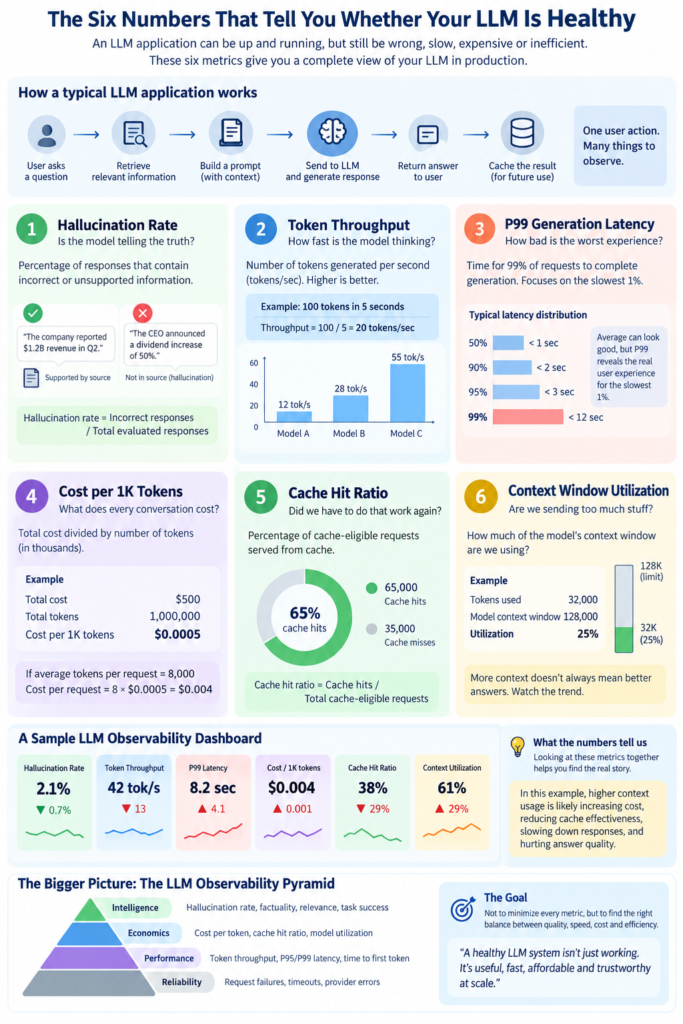
An LLM application can look perfectly healthy on the surface. The API is responding, users are getting answers, and the application dashboard is showing green lights everywhere. But anyone who has run an LLM system in production knows that “working” and “working well” are two very different things. A model can give a confident but incorrect answer, take ten seconds to respond to one unlucky user, consume an enormous amount of context, or quietly push your monthly bill much higher than expected. This is where LLM observability becomes important. Instead of simply asking whether the model is available, we need to understand what it is doing, how fast it is doing it, how much it costs, and—most importantly—whether we can trust the result.
The first number I would want to know is the hallucination rate. Imagine a customer asks an AI assistant about a company’s refund policy. The assistant responds immediately with a beautifully written explanation, except one of the rules it mentioned doesn’t actually exist. Nothing crashed. There was no HTTP error. From the application’s perspective, the request was successful. From the customer’s perspective, it was a failure. Hallucination rate tries to put a number around this problem: how many evaluated responses contain incorrect or unsupported information? Measuring it isn’t as straightforward as measuring CPU utilization, because you need some way of judging the answer against a source, expected result, or human evaluation. But it gives us something infrastructure metrics cannot: a view of whether the intelligence we are paying for is actually producing trustworthy results.
Then comes token throughput, usually measured in tokens per second. This tells us how quickly the model is generating an answer. Suppose a model produces 100 tokens in five seconds—that is 20 tokens per second. It sounds simple, but this number becomes very important as traffic grows. A model that feels perfectly responsive with ten users may struggle when hundreds or thousands of users arrive simultaneously. And throughput doesn’t tell the whole latency story. A user doesn’t experience “tokens per second”; they experience waiting. That’s why another metric, P99 generation latency, matters. Average latency might tell us that an application responds in two seconds, while P99 could reveal that the slowest 1% of requests take twelve seconds. Those are the users who often end up asking, “Is this thing actually working?”
Once an LLM application starts receiving serious traffic, the next question usually arrives from a completely different department: How much is this costing us? LLM usage is closely tied to tokens, so cost per 1K tokens gives us a useful way to understand the economics of the system. But the real insight comes when we connect cost with everything else. If a request used to consume 4,000 tokens and now consumes 20,000, the model may not have become more expensive—but the application has. One of the biggest reasons this happens is context. Conversation history, retrieved documents, system instructions, examples, and tool results can gradually turn a small prompt into a very large one. Context-window utilization helps us see this happening. If an application starts using 10% of its available context and slowly climbs to 60% or 70%, that trend deserves attention. More context isn’t automatically better; sometimes a smaller amount of highly relevant information produces a better answer than a huge pile of loosely relevant information.
There is another deceptively simple metric that can make a significant difference: cache hit ratio. Imagine thousands of users are asking similar questions, and every request triggers the same expensive retrieval and model computation. If the application can safely reuse a previous result, there is no reason to perform all that work again. Cache hit ratio tells us what percentage of cache-eligible requests were successfully served from the cache. A 65% hit ratio, for example, means that 65 out of every 100 eligible requests avoided the full computation. That can reduce latency, model usage, and cost. But, just like the other metrics, the highest number isn’t necessarily the best number. A cache that serves outdated or inappropriate answers isn’t an optimization—it is a new problem. Observability is therefore less about chasing individual numbers and more about understanding what those numbers are telling us about the application.
This is where the six metrics become much more useful when viewed together. Imagine a production dashboard suddenly shows hallucination rate rising from 1.4% to 2.1%, token throughput falling from 55 to 42 tokens per second, P99 latency jumping from four to eight seconds, cache hit ratio dropping from 67% to 38%, and context utilization climbing from 32% to 61%. Six different metrics are telling what appears to be six different stories. In reality, they may all point to one change: the application has started sending dramatically more context to the model. That extra context increases token consumption, slows generation, makes requests less cacheable, increases cost, and may even introduce irrelevant information that hurts answer quality. That is the real value of LLM observability—not collecting six numbers, but connecting them to understand what is happening inside the system. A healthy LLM application isn’t simply one that is up. It is one that is trustworthy, responsive, economically sustainable, and efficient enough to keep running as the number of users grows.
Check your understanding
2 questions. Answer them, then check your score.
-
Adding more consumers than partitions increases throughput.
A partition is read by at most one consumer in a group, so extra consumers sit idle.
-
What does a growing consumer lag tell you?
One Response