FIRE number calculator
- Years to reach it
- —
- Age when you get there
- —
- You contribute
- —
- Growth does the rest
- —
- Monthly income it supports
- —
- What you put in
- Investment growth
- FIRE number
| Rate | FIRE number | Years away |
|---|
How the FIRE number is calculated
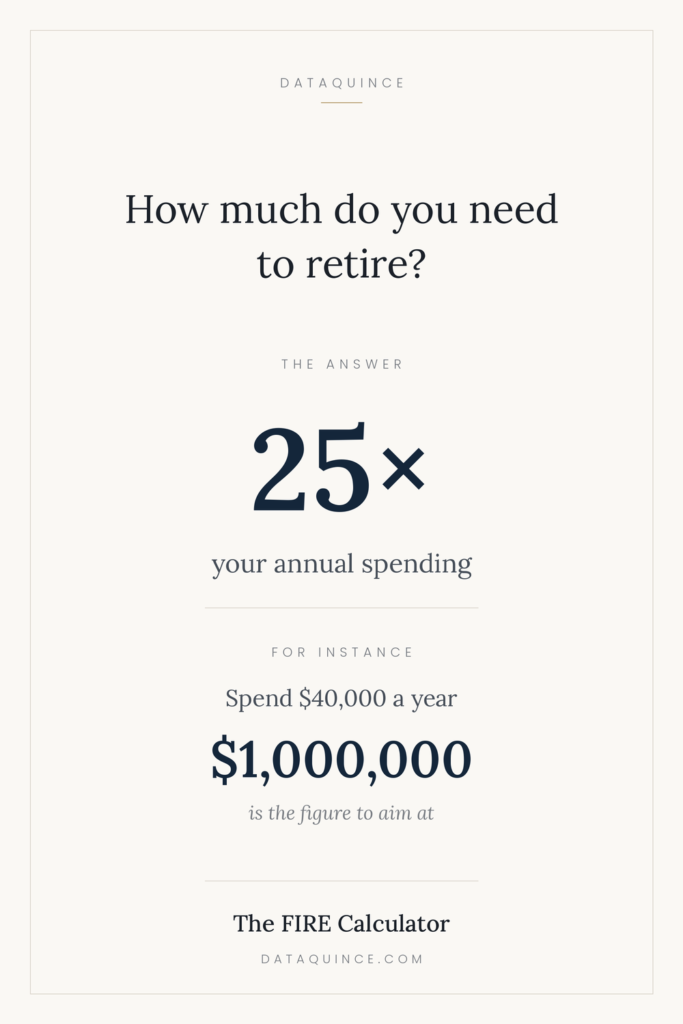
Your target is annual spending divided by your withdrawal rate. At 4% that is 25 times your spending; at 3% it is roughly 33 times; at 5% it is 20 times. The multiple moves sharply, which is why the withdrawal rate matters more than any other input here.
FIRE number = Annual spending ⁄ Withdrawal rate
Growth is compounded monthly using a real return — your nominal return minus inflation — so every figure shown is in today's money. That is what makes the target and the projection comparable: a target set in today's spending has to be met by a portfolio measured the same way.
Where the 4% rule comes from, and what it assumes
The figure traces to the Trinity study and William Bengen's work in the 1990s, which tested historical US market data and found that withdrawing 4% of a starting balance, rising with inflation, survived a 30-year retirement in almost every historical period.
Three assumptions ride along with it. It was built for a 30-year retirement, so retiring at 40 stretches it well past what was tested. It rests on US market history, which was unusually strong by global standards. And it assumes a stock-heavy portfolio held through crashes without flinching, which is easier in a spreadsheet than in life.
None of that makes 4% wrong. It makes it a starting point rather than a guarantee, which is why the table above shows what happens if you are more or less cautious.
What this model leaves out
This projects a smooth average return. Real markets do not deliver one, and the order of returns matters enormously — a crash in your first two years of retirement does far more damage than the same crash a decade in, even with identical average returns. That risk is invisible in any straight-line calculator, including this one.
Also excluded: taxes on withdrawals, state or public pensions arriving partway through, healthcare costs, and any spending that changes with age. Treat the output as a target to aim at, not a plan to file away. This is educational and not financial advice — a qualified adviser can model your own tax position and timeline properly.
Every company that runs out of money runs out of it on a date somebody could have calculated months earlier. Runway is the number of months you can keep operating before the balance hits zero, and it is the one figure that changes what you should do this week rather than next year.
The arithmetic is trivial. The reason people still get it wrong is that burn means two different things, and the one most founders quote is the one that flatters them.
Gross burn and net burn are not the same number
Gross burn is everything leaving the account each month — salaries, cloud bills, rent, software, contractors. It is what you spend.
Net burn is gross burn minus revenue. It is what you actually lose.
A company spending 70,000 a month with 20,000 of revenue has a gross burn of 70,000 and a net burn of 50,000. Runway is calculated from net burn, because revenue genuinely offsets the outflow.
The distinction matters when revenue is growing. Gross burn stays flat while net burn shrinks, and runway extends without anyone cutting anything. It matters in the other direction too: if that revenue sits with one customer, the net figure is a promise rather than a fact. Investors ask for gross burn precisely because it is the number that survives a churned contract.
The formula
Runway (months) = Cash / (Gross burn - Revenue)
For the numbers above:
500,000 / (70,000 - 20,000) = 500,000 / 50,000 = 10 months
That holds when expenses stay steady. They rarely do.
Why expense growth changes the answer so much
Add a hire, a bigger cloud bill, a new tool, and burn creeps upward. The calculator models this as a monthly percentage, and it compounds — which is why the result falls faster than intuition suggests.
Same company, 500,000 in cash and 50,000 net burn, with expenses growing each month:
| Monthly expense growth | Runway |
|---|---|
| 0% | 10 months |
| 3% | 9 months |
| 5% | 8 months |
| 10% | 7 months |
Three months of runway disappear to a growth rate most teams would call modest. Nobody decides to shorten their runway by 30%; it happens one reasonable hire at a time.
This is also why a single flat number on a board slide misleads. Runway is a projection, and projections need their assumptions stated alongside them.
What the number does not tell you
Runway assumes the future looks like the present. Four things break that:
- Lumpy costs. Annual insurance, tax bills, hardware, a conference. A quarterly average smooths these; a single month does not.
- Collections, not invoices. Revenue counts when the cash arrives. Sixty-day terms make the money real to your accountant and imaginary to your bank balance.
- Severance. Cutting costs costs money first. A team reduction usually makes the next month worse before it makes anything better.
- The fundraise itself. Raising takes three to six months of founder attention. Runway that ends when the round closes has already ended.
The practical rule most operators use: start raising at twelve months, because closing takes six and you do not want to negotiate with three left. Below six months your options narrow to cutting or a bridge, and both get decided by someone other than you.
Default alive
Paul Graham’s framing is the most useful one-line test: if your current growth continues and you never raise again, do you reach profitability before the money runs out? If yes, you are default alive. If no, default dead.
The calculator flags this — when revenue covers expenses there is no runway limit to report, because the balance grows instead of depleting.
Most companies believe they are default alive well before they actually become it. Checking the number honestly, once a quarter, is the entire exercise.
Note: this calculator is for education and planning, not financial advice. It assumes constant revenue, evenly distributed costs and no financing events. It is not a substitute for a cash flow forecast built from your actual figures, or for a conversation with your accountant.